Technical Analysis
The price-action concepts worth testing — trends, FVGs, order blocks, CRT and timeframe correlation — with chart examples for each.
Market Trends
Market trends — the direction the market is generally moving in. There are three types:
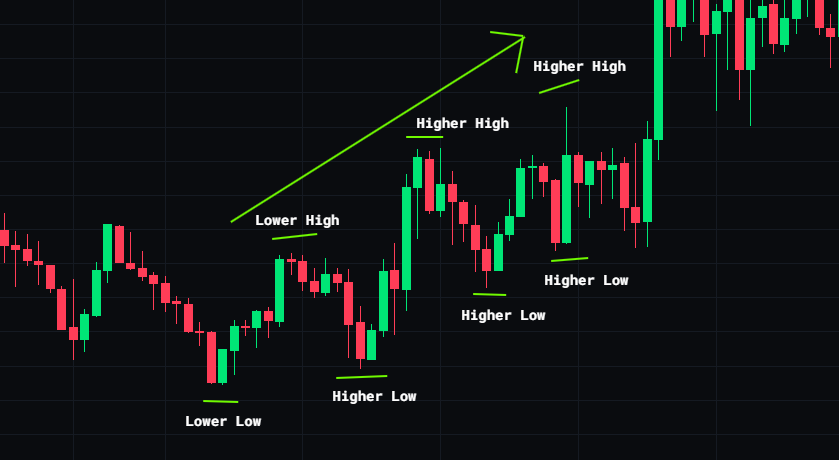
Uptrend — higher highs + higher lows. Market is going up.
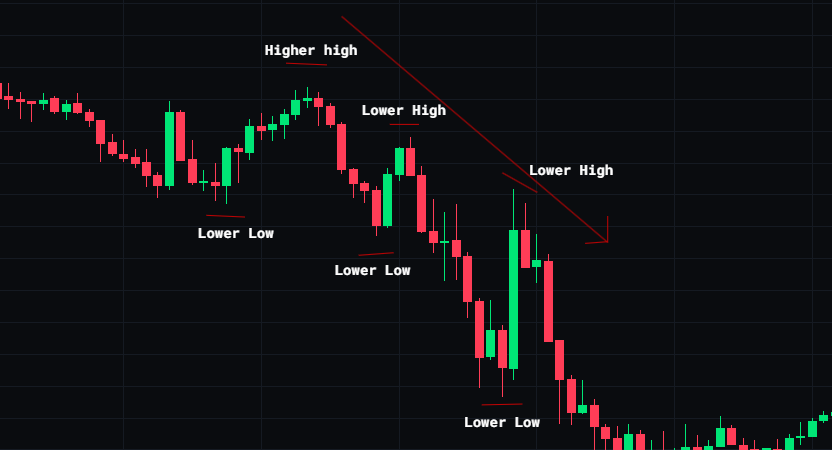
Downtrend — lower highs + lower lows. Market is going down.
.png)
Sideways (Range) — price oscillates between support and resistance with no clear direction.
Fair Value Gap (FVG)
A Fair Value Gap (FVG) is a price imbalance created when the market moves aggressively in one direction, leaving a gap between candles where little or no trading occurred.
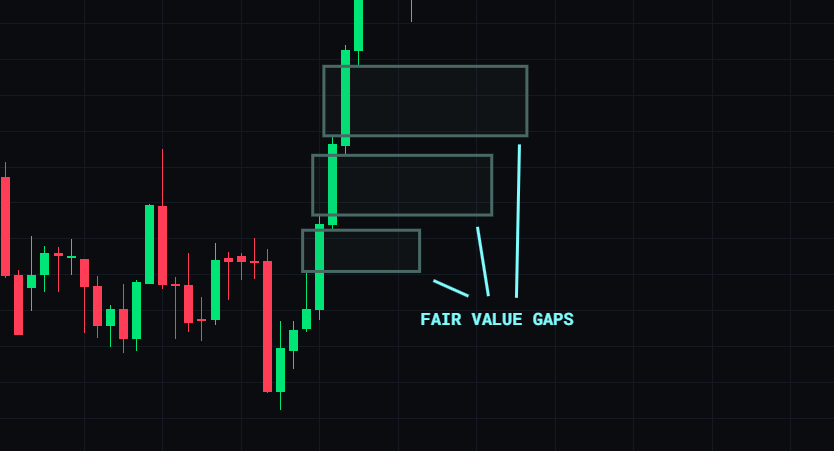
If the high of Candle 1 does not overlap with the low of Candle 3 (in a bullish move), a gap is created between them — that is the Fair Value Gap.
Order Block
An Order Block is the last opposing candle before a strong impulsive move. Traders believe price may return to this zone before continuing in the same direction.
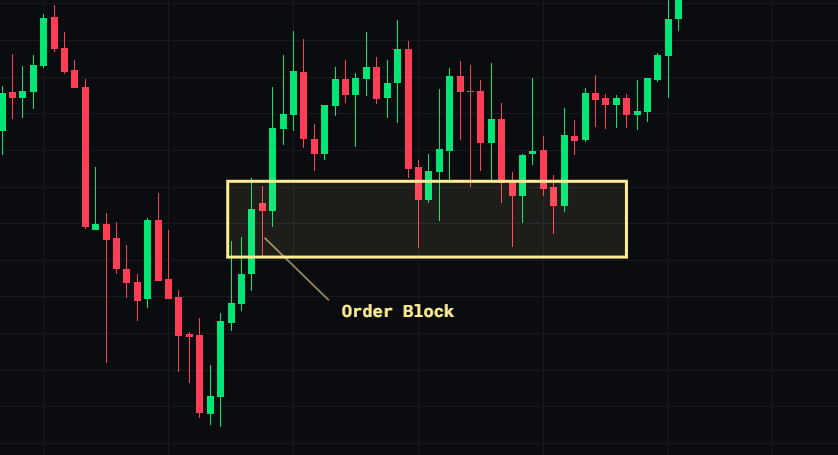
Price often revisits order blocks because institutions may have unfilled orders, the market seeks liquidity, and it aligns with structure and imbalance.
Candle Range Theory (CRT)
Candle Range Theory (CRT) — every candle has its own liquidity. The next candle fails to break it with a body and "absorbs" the liquidity, leaving only a wick above the previous high.
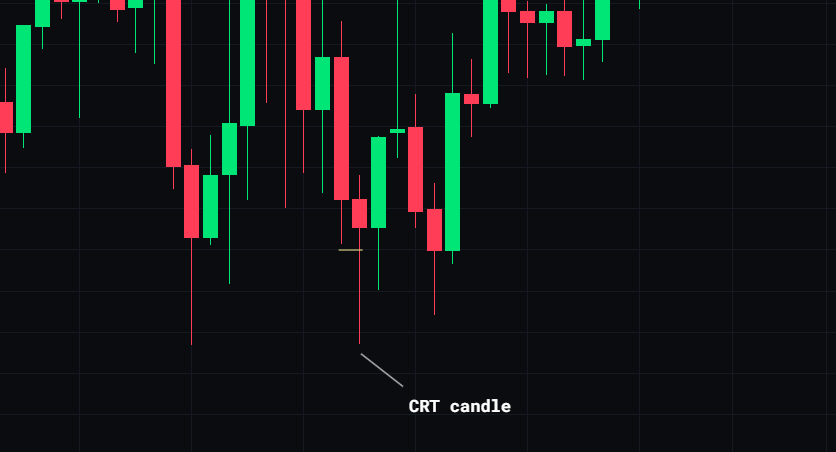
Price may: sweep one side of the range (high or low), then reverse toward the opposite side.
Time Frame Correlation
Time frame correlation means aligning multiple time frames to trade with clearer direction and higher probability.
- If the higher timeframe is bullish AND the lower timeframe shows a bullish setup → the trade has stronger alignment
- If they conflict → the lower timeframe move may only be a short-term pullback
Indicators
Indicators are tools that use mathematical calculations based on price, volume, or time to help traders analyze the market.
.png)
They do not predict the future. They react to what price has already done — they always lag behind price.
Test yourself — 6 questions
Pick an answer to see instantly whether it is right. Nothing is saved to a server and no account is needed.
-
01What defines an uptrend?
-
02A Fair Value Gap (FVG) is best described as:
-
03An Order Block is:
-
04In Candle Range Theory (CRT), what does the CRT candle do?
-
05Why do indicators lag behind price?
-
06What does time frame correlation mean?
Now test it on real historical charts
Reading is step one. Replay real historical data bar by bar, place the trades this module describes, and see whether the idea actually holds up before you risk money on it.
Start backtesting freeFree plan — no card required.