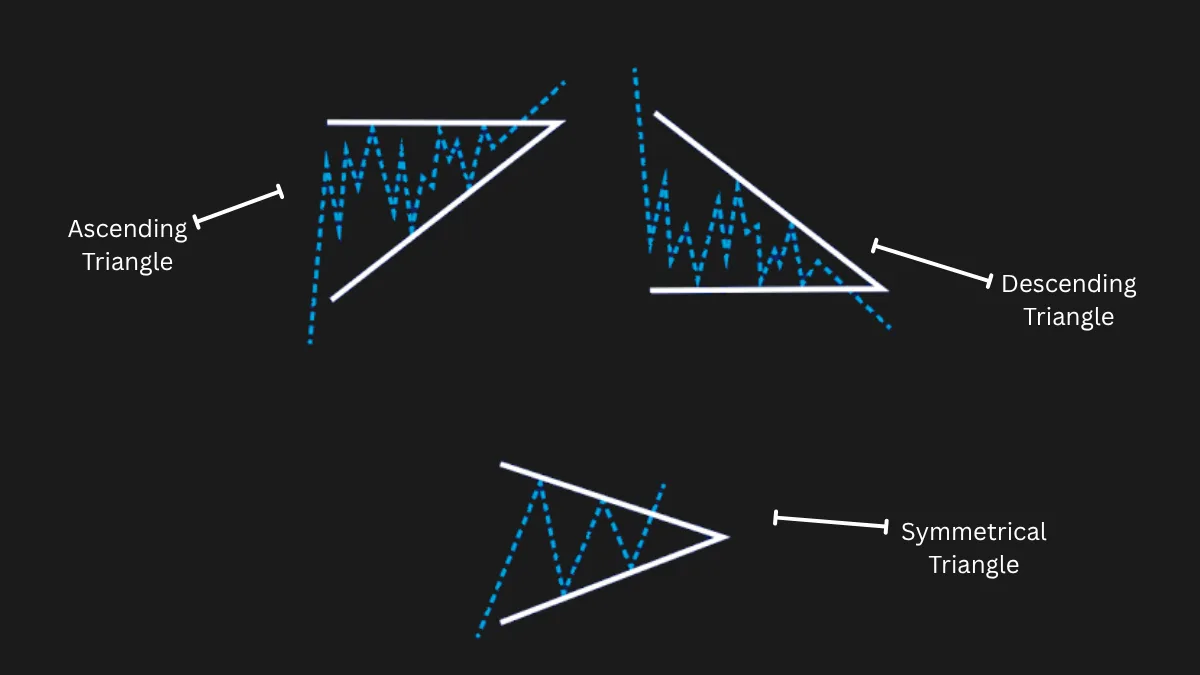
The triangle chart patterns is a continuation pattern - one of the recurring shapes traders watch to time entries with a clear stop and target. Below is how to spot the clean version, trade it with defined risk, and prove it works before you rely on it.
What it looks like
A triangle forms when the highs and lows converge. There are three types. An ascending triangle has a flat top and rising lows - buyers pressing into resistance, usually breaking up. A descending triangle has a flat bottom and falling highs - sellers pressing into support, usually breaking down. A symmetrical triangle has both lines converging and is neutral, breaking in the direction of the prevailing trend more often than not.
Whatever the type, the trade is the same: wait for a decisive close outside the triangle, then trade the break. Entering inside the triangle is guessing; entering on the break is reacting.
The structure at a glance
How to trade it
Every version of this setup shares the same three decisions - a trigger to enter, a level that invalidates the idea, and a measured place to take profit:
Where most traders lose with this pattern: forcing it. A pattern that needs squinting to see is not there. Wait for the clean version, let price confirm the break or retest, and size the trade with the position size calculator so a failed pattern costs a fixed, small amount.
Backtest it before you trust it
Triangles are drawn after the fact in almost every tutorial you will ever read, which is precisely why they look so reliable. Replaying the chart one bar at a time in FxBacktest removes that luxury: the apex is hidden until price gets there, so you find out whether you would really have taken the break, or only think you would have. Our pattern win-rate research shows how far that gap usually runs.
This pattern is a starting hypothesis, not a signal. The only way to know whether it pays on your pairs is to replay real charts and trade it by hand across a large sample, then read the win rate, risk-reward, and expectancy it produces. Patterns that look obvious in a textbook often behave very differently across a hundred real trades.
Triangle Patterns FAQ
Which way does a triangle pattern break?
An ascending triangle usually breaks upward and a descending triangle usually breaks downward, because the flat side shows which pressure is winning. A symmetrical triangle is neutral and tends to break in the direction of the trend that preceded it. None of these are certainties - always wait for the actual break.
How do you trade a triangle breakout?
Wait for a decisive close outside the triangle rather than anticipating the break. Enter on that close or on a retest of the broken line, place your stop back inside the triangle, and set a target equal to the height of the triangle's widest part projected from the breakout point.
What is the difference between a triangle and a wedge?
Triangles compress toward a neutral or trend-aligned breakout and are usually continuation patterns. Wedges slope entirely in one direction - both lines tilt the same way - and often signal a reversal against that slope. A rising wedge leans up but tends to break down, and vice versa.