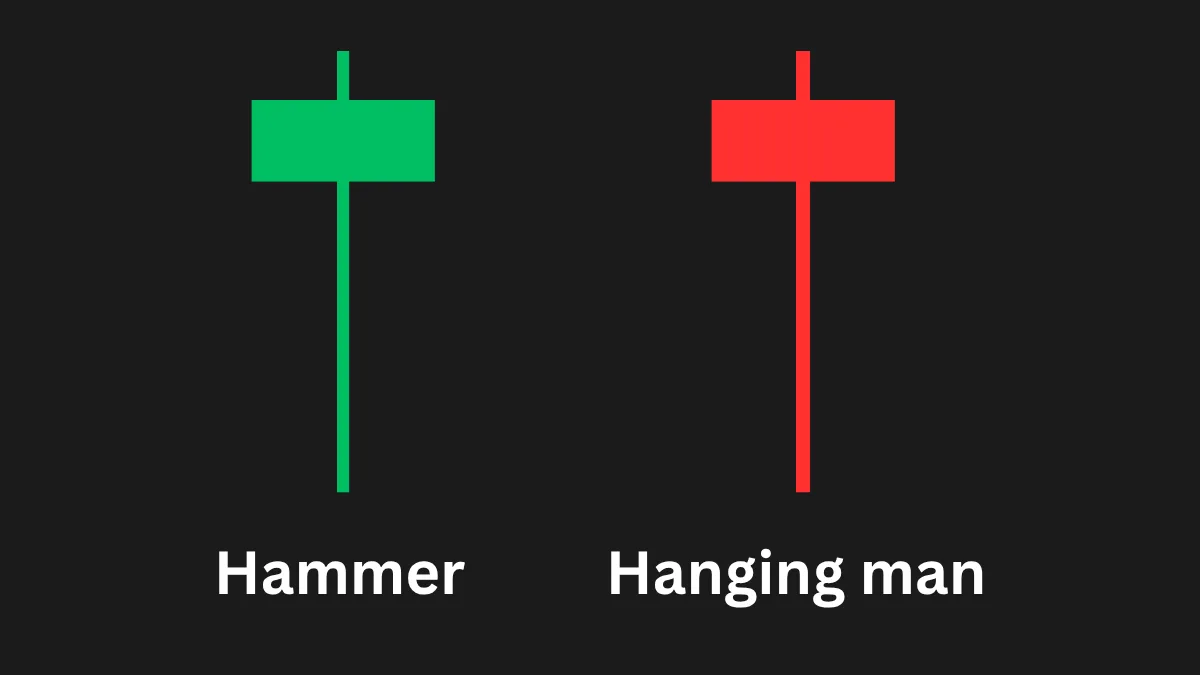
The hammer and the hanging man are the same candle - a small body sitting at the top of a long lower wick. What separates them is where they form. A hammer ends a downtrend and signals a bounce; a hanging man appears in an uptrend and warns of a top.
What it looks like
The long lower wick means price sold off hard during the bar, then buyers dragged it back to close near the open. At the bottom of a downtrend that rejection is bullish - a hammer. At the top of an uptrend the same rejection warns that sellers are starting to appear beneath the highs - a hanging man - and it needs a bearish close afterwards to confirm.
Anatomy at a glance
How to trade it
A candle is a trigger, not a system. Take it only where it means something - at a level, with the trend - and give it a clear stop and target:
Where traders go wrong: taking the candle anywhere. In the middle of a range this signal is noise. Wait for it to form at support or resistance or in line with the trend, and size the trade with the position size calculator so a failed signal costs a small, fixed amount.
Prove it before you trade it
This candle is a hypothesis about what happens next, nothing more. Replay real charts, take the pattern only at meaningful levels across a large sample, and read the win rate and risk-reward it delivers on your pairs before you rely on it.
Hammer & Hanging Man FAQ
What is the difference between a hammer and a hanging man?
They are the same shape - a small body with a long lower wick - but form in opposite trends. A hammer appears at the bottom of a downtrend and is bullish; a hanging man appears at the top of an uptrend and is bearish. Only the trend context tells them apart.
Is a hammer candlestick bullish?
Yes, when it forms at the bottom of a downtrend, ideally at a support level. The long lower wick shows sellers pushed price down but buyers rejected the lows and closed near the open. Confirmation comes from the next candle breaking above the hammer's high.
How reliable is the hammer pattern?
Reliability depends entirely on context and confirmation. A hammer at a tested support level, in line with the higher-timeframe trend, and confirmed by a follow-through candle is far stronger than one floating in a range. Backtest it on your pairs to find its real win rate before relying on it.